nRF Profiler
The nRF Profiler sample demonstrates the functionality of the nRF Profiler library. It shows how to use the nRF Profiler to log and visualize data about custom events that are not part of the Application Event Manager.
Requirements
The sample supports the following development kits:
Hardware platforms |
PCA |
Board name |
|
|---|---|---|---|
PCA10090 |
|
||
PCA10095 |
|
||
PCA10040 |
|
||
PCA10056 |
|
||
PCA10112 |
|
For more security, it is recommended to use the */ns variant of the board target.
When built for this variant, the sample is configured to compile and run as a non-secure application using security by separation.
Therefore, it automatically includes Trusted Firmware-M that prepares the required peripherals and secure services to be available for the application.
Overview
The sample initializes the nRF Profiler and registers and periodically profiles the occurrences of the following event types:
Event without data (
no data event) - This event is used to signal the occurrence of an event only. It does not contain additional data.Event with data (
data event) - There are several numerical values associated with this event. The values are updated periodically.
Configuration
See Configuring and building for information about how to permanently or temporarily change the configuration.
Building and running
This sample can be found under samples/nrf_profiler in the nRF Connect SDK folder structure.
For more security, it is recommended to use the */ns variant of the board target (see the Requirements section above.)
When built for this variant, the sample is configured to compile and run as a non-secure application using security by separation.
Therefore, it automatically includes Trusted Firmware-M that prepares the required peripherals and secure services to be available for the application.
To build the sample, follow the instructions in Building an application for your preferred building environment. See also Programming an application for programming steps and Testing and optimization for general information about testing and debugging in the nRF Connect SDK.
Note
When building repository applications in the SDK repositories, building with sysbuild is enabled by default.
If you work with out-of-tree freestanding applications, you need to manually pass the --sysbuild parameter to every build command or configure west to always use it.
Testing
After programming the sample to your development kit, you can test it by performing the following steps:
Go to the
scripts/nrf_profilerfolder.Run the script
real_time_plot.py, with the name that should be used to store the data as the argument. For example:python3 real_time_plot.py *test_name*This command generates a
test_name.csvfile and atest_name.jsonfile. The script opens a GUI window that displays events as dots on timelines, similar to the following plot.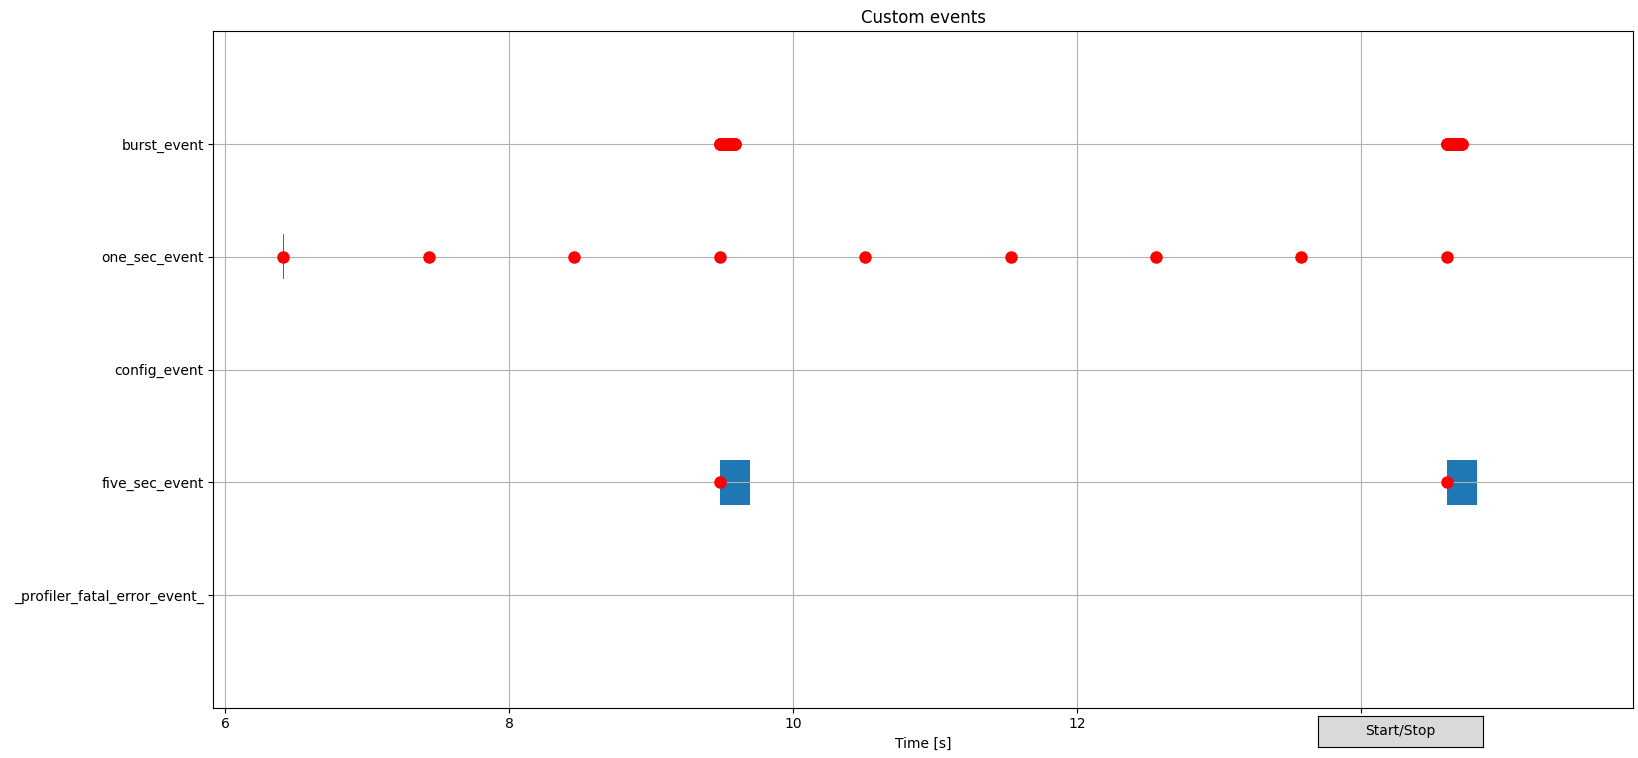
Example of nRF Profiler host tools GUI window
See the Data visualization GUI section in the nRF Profiler host tools documentation for more information about the GUI.
Connect to the kit with a terminal emulator (for example, the Serial Terminal app). See Testing and optimization for the required settings and steps. After you connect, the sample will display messages in the terminal.
Calculate the nRF Profiler event propagation statistics (statistics for time intervals between nRF Profiler events) from the previously collected dataset using the following command:
python3 calc_stats.py *test_name* stats_nordic_presets/nrf_profiler.jsonThe
stats_nordic_presets/nrf_profiler.jsonfile specifies the nRF Profiler events used for the calculations. The file refers to the events used by the sample. See the Calculating statistics section in the nRF Profiler host tools documentation for more information.
Dependencies
This sample uses the following nRF Connect SDK subsystems:
In addition, it uses the following secure firmware component: