nRF Profiler host tools
The nRF Profiler host tools is a set of Python scripts that you can use to visualize and analyze the nRF Profiler events received over RTT from an embedded device running the nRF Profiler library. You can use the scripts for both Application Event Manager events and custom events.
Overview
Some of the scripts are used for connecting with an embedded device running the nRF Profiler and collecting the nRF Profiler events over RTT. The collected profiling data is stored as local files and can be processed later. Other scripts are used for visualizing, processing, and analyzing the data or calculating statistics. These scripts rely on locally stored files created earlier.
Note
Since the nRF Connect SDK v3.4.0 release, host scripts have been updated to support the nRF54L Series SoC.
To achieve this, the hardware clock frequency (CONFIG_SYS_CLOCK_HW_CYCLES_PER_SEC) is now sent from the SoC to the host tools over the existing Info RTT channel.
This change breaks backward compatibility between the nRF Profiler library and host tools due to modifications in the Info RTT channel string layout.
Ensure that you use the updated version of the scripts together with the corresponding library version.
Requirements
To use the nRF Profiler host tools, install the required packages and libraries specified by the requirements.txt file using the following command:
pip3 install --user -r requirements.txt
Apart from this, make sure to enable and configure the nRF Profiler library on a connected embedded device. The library introduces an RTT-based interface for providing profiling data. See the library documentation for details.
Tip
The nRF Profiler sample and the Application Event Manager profiling tracer sample provide an out-of-the-box nRF Profiler integration.
Using the scripts
The scripts collecting profiling data from an embedded device use CSV files for storing event occurrences and JSON files for storing event descriptions. A pair of related files shares a common dataset name. You can use the dataset name to identify the files for data visualization or calculating statistics.
See the following subsections for information about available scripts and example usages.
Use the --help argument while executing a given script to display help and learn more about available options.
Data collection and visualization
You can use the following scripts to collect the profiling data and visualize the data:
data_collector.py- The script connects to the device using RTT, receives profiling data, and saves it to files. When running the script from the command line, provide the time for collecting data and the dataset name. For example:python3 data_collector.py 5 test1In this command,
5is the time value (in seconds) for collecting data andtest1is the dataset name.plot_from_files.py- The script plots events from the dataset that is provided as the command-line argument. For example:python3 plot_from_files.py test1In this command,
test1is the dataset name.real_time_plot.py- The script connects to the device using RTT, plots data in real-time, and saves the data. When running the script from the command line, provide the dataset name. For example:python3 real_time_plot.py test1The script terminates when the window displaying the real-time plot is closed.
Data visualization GUI
When you plot the profiling data, the nRF Profiler events are visualized in a GUI window.
The visual output can look as follows:
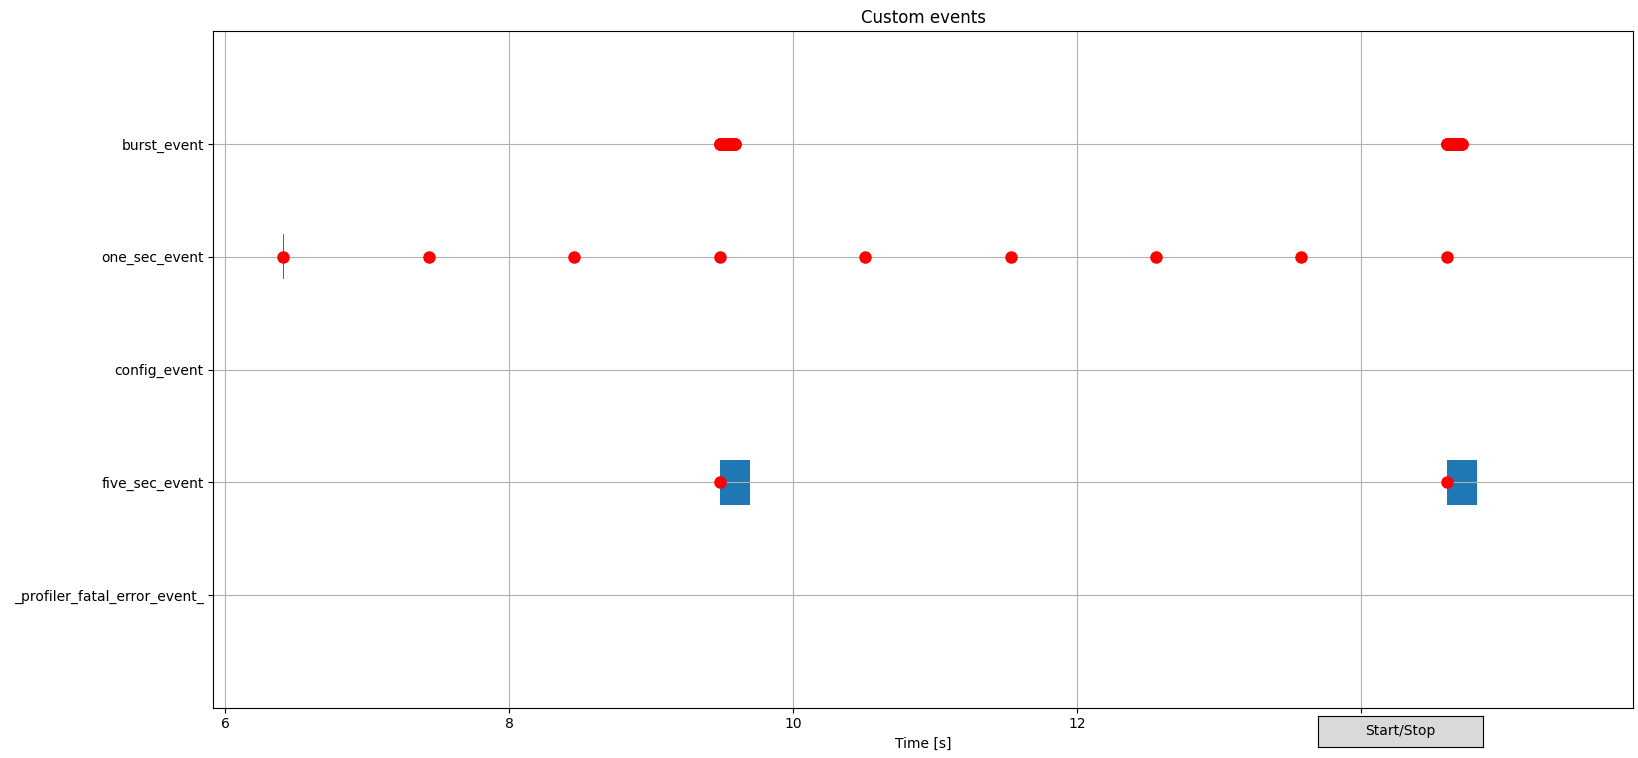
Example of nRF Profiler host tools visualization
Profiled events visualization
The nRF Profiler events are visualized in the following way in the plot:
Red dotindicates submission of a custom nRF Profiler event or an Application Event Manager event.Blue vertical rectangleindicates processing of the Application Event Manager event (not used for custom nRF Profiler events).
You can use the middle mouse button to mark an event submission or processing for tracking, and to display the event data.
Using GUI while plotting
The GUI also supports the following actions:
The Start/Stop button can be used to pause or resume the real-time plot translation while plotting the data in real time (
real_time_plot.py).Scrolling on the plot using the mouse wheel zooms it in or out.
While plot translation is paused, scrolling zooms to the cursor location.
While plot translation is active, scrolling zooms to the right edge of the plot.
Additionally, during a pause or when plotting data from files:
Click and drag with the left mouse button to pan the plot.
Click the left or right mouse button to place a vertical line at the cursor location. When two lines are present, the application measures the time between them and displays it.
Merging profiling data from multiple devices
The scripts allow you to analyze data propagation among multiple embedded devices.
The merge_data.py script combines data from test_p and test_c datasets into one dataset test_merged.
It also provides clock drift compensation based on the synchronization events sync_event_p and sync_event_c.
The clock drift compensation is necessary to properly measure times between events coming from different devices as every device uses its own clock source.
As command-line arguments, provide the names of events used for synchronization for a Peripheral (sync_event_p) and a Central (sync_event_c), as well as names of datasets for the Peripheral (test_p), the Central (test_c), and the merge result (test_merged).
For example:
python3 merge_data.py test_p sync_event_p test_c sync_event_c test_merged
The newly created dataset (test_merged) contains the nRF Profiler events registered by both devices with compensated clock drift.
You can use it for visualization or calculating statistics.
Note
The synchronization profiler events need to be periodically generated exactly at the same time on both devices. The nRF Profiler library does not implement the generation of the synchronization events. An application must provide its own implementation. See the nRF Profiler synchronization module for an example implementation used by the nRF Desktop application.
Calculating statistics
The calc_stats.py script is used to calculate and visualize the nRF Profiler event propagation statistics (statistics for time intervals between nRF Profiler events) for a given dataset.
A JSON file containing test presets specifies the events to be analyzed.
The script calculates and displays the following statistics for each test preset:
basic statistics (min, max, mean, median, standard deviation)
histogram plot
plot of subsequent time intervals between events
For some of the statistics, the script also filters out time intervals that deviate from the other records.
These statistics are denoted by a no outliers suffix in the plot title and output file name.
Apart from displaying the statistics, the scipts also stores them as local files under the data_stats/ directory.
The results are organized in subdirectories based on the dataset name, time range, and test preset name.
When running the script from the command line, provide the dataset name (test1) and path to the JSON file containing test presets (stats_nordic_presets/app_event_manager_profiler_tracer.json).
python3 calc_stats.py test1 stats_nordic_presets/app_event_manager_profiler_tracer.json
Tip
Before calculating statistics using the example command, you need to collect profiling data from a device running the Application Event Manager profiling tracer sample and store the data as the test1 dataset.
Make sure to use the mentioned sample, because the test preset refers to sample-specific nRF Profiler event names.
If you want to calculate statistics for your own application, you need to create a new test preset file that refers to the nRF Profiler events used by your application. You can use the script to calculate statistics for custom nRF Profiler events or Application Event Manager events, or both.
Test preset JSON file format
The test preset JSON file contains an array of test presets. Every test preset is identified by a unique name. The script calculates the time intervals between start and end events specified by each test preset. The script uses the time intervals as input data for calculating statistics.
An example of an array containing a single test preset looks as follows:
[
    {
        "name": "Test Name",
        "start_event": {
            "name": "event_name_1",
            "state": "submit"
        },
        "end_event": {
            "name": "event_name_2",
            "state": "processing_end"
        }
    }
]
Fields:
name- Name of the test preset (used for output files and plot titles)start_event- Configuration for the start eventname- Name of the eventstate- Event state (optional, defaults to “submit”)Possible values:
submit- Event submissionprocessing_start- Event processing start (only for Application Event Manager events)processing_end- Event processing end (only for Application Event Manager events)
end_event- Configuration for the end event (same format asstart_event)
For examples of the test preset JSON file, see the stats_nordic_presets/ directory.
Dependencies
The scripts depend on Python packages and libraries specified by the requirements.txt file.
Apart from them, the scripts depend on the nRF Profiler library running on an embedded device to provide nRF Profiler events.